[소스코드공개] Processing을 이용한 NT-ARSv1 모니터링 프로그램
이번 글의 목적은 사실 Processing이라는 언어에서 저희 제품인 NT-ARSv1의 데이터를 핸들링하는 예제를 보여드릴려고 했습니다. 그런데 예제 작업을 하다보니 그냥 정식버전이라고 부르기엔 좀 약하지만 어쩌다 보니 그냥 모니터링 프로그램이 되어 버렸습니다. 그래도 Processing의 전체 소스코드도 공개하는 (사실 배포본을 만들어도 소스는 공개되지만 말이죠^^) 모양새가 되었습니다.
이 프로그램은 자바기반의 Processing으로 만들어 졌습니다. 그래서 자바가 설치되어 있어야합니다. 윈도우에 기본으로 포함되어 있진 않아도 다들 깔려있기 때문에 별 문제없이 실행이 될겁니다. NT-ARSv1[바로가기]과의 연결은 이전에 응용예제[바로가기]에서 많이 다루었으니 그 글들을 확인하시기 바랍니다. 일단 PC와 NT-ARSv1은 잘 연결되었다고 보고 글을 적도록 하죠.
일단 프로그램부터 다운로드 받으셔야죠^^
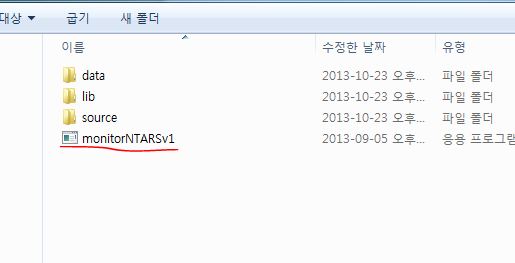
먼저 압축된 파일을 풀고
하나밖에 없는 응용프로그램을 실행하시면 됩니다. Processing 에디터인 PDE프로그램에서 source 폴더에 있는 pde화일을 열면 전체 소스코드를 열람하실수 있습니다.
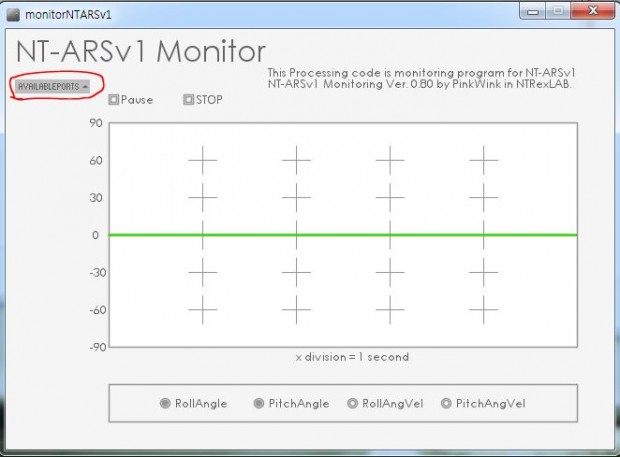
그 상태에서 AVAILABLEPORTS라는 드롭다운리스트를 열면 현재 PC에서 접근가능한 가상 COM Port의 리스트가 뜹니다.
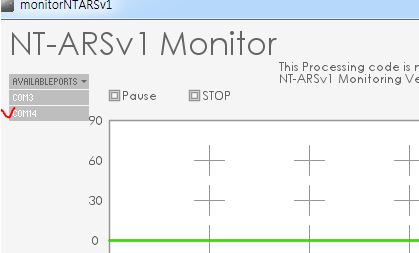
거기서 ARS가 연결된 포트를 선택해 주시면 됩니다. 본 예제를 적을때 제 PC에서는 COM14번이었습니다. 만약 잘못된 COM 포트를 선택하시면 프로그램 오류가 납니다. 물론 에러 디택팅을 통해서 다시 선택하게 할 수 있겠지만, 말씀드렸듯이 정식버젼도 아니고 또, 예제의 성격이라고 비겁하게 변명하겠습니다.ㅠㅠ. 그렇게 COM 포트까지 선택하면
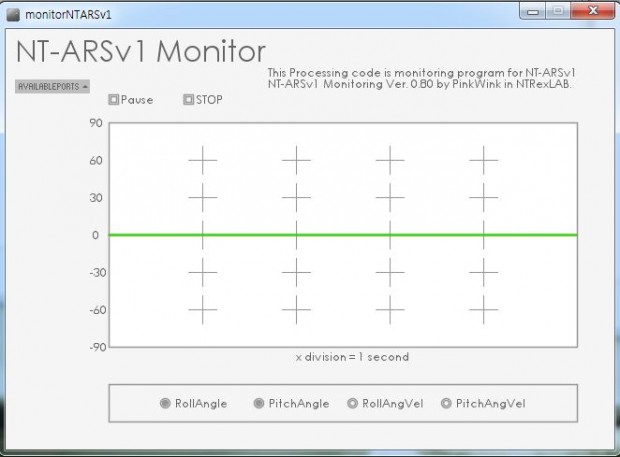
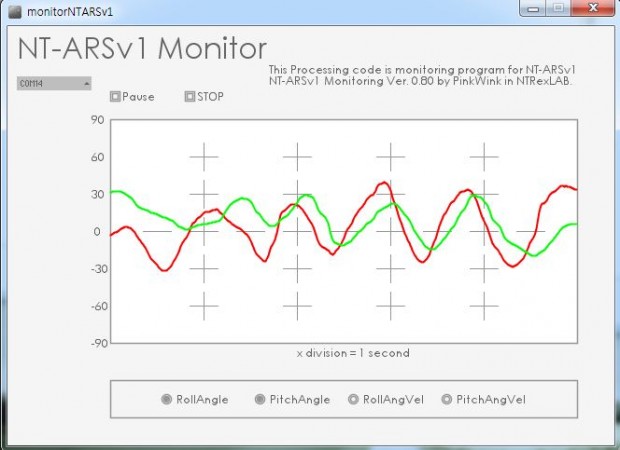
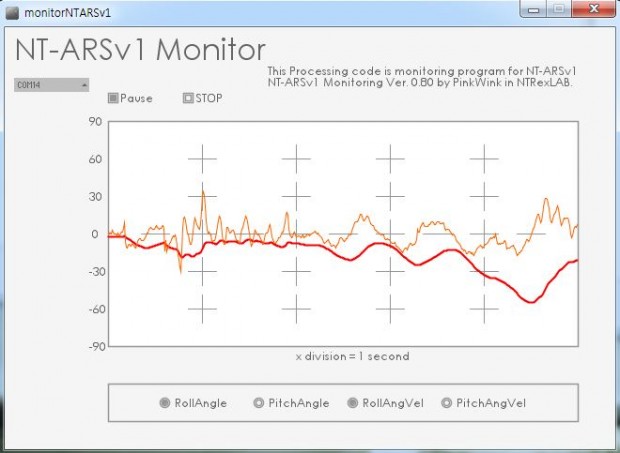
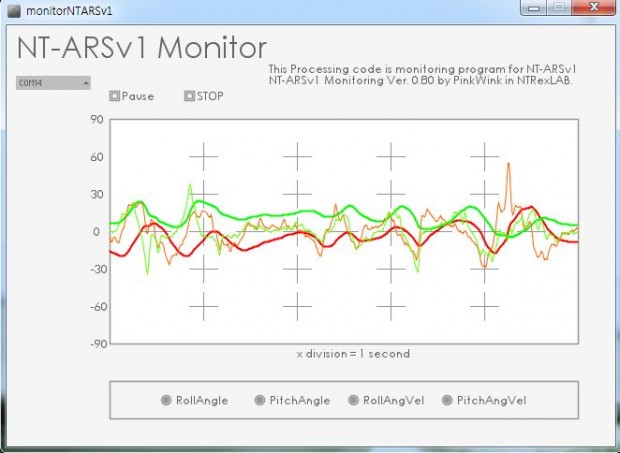
갑자기 그래프가 그려지기 시작할겁니다. 프로그램 하단에 Roll각도와 Pitch각도를 기본으로 그리도록 되어있습니다. 보고 싶은 각도를 선택하면 됩니다. 물론 그래프별로 legend를 달았어야합니다만, 클릭한번하면 어떤 그래프인지 알 수 있기때문에 과감하게 생략했습니다.
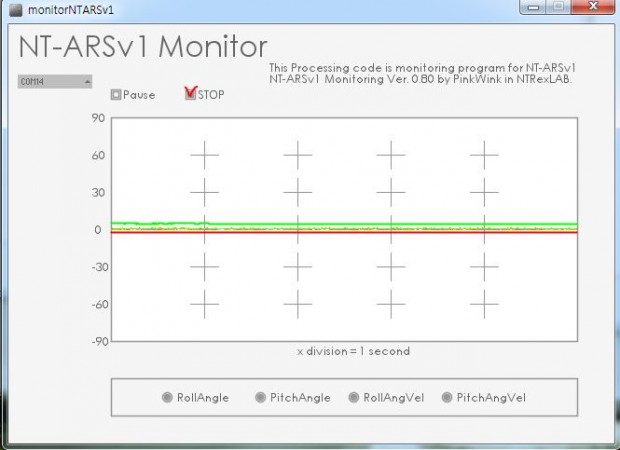
그리고, Pause를 누르면 그래프가 일시 정지됩니다. 또한 STOP을 누르면 ARS에 데이터를 보내지 말라는 명령(<CAE>)을 전송해서 데이터를 받지를 않습니다. 만들고 나서 보니 Pause버튼과 STOP 버튼이 큰 차이가 없네요.ㅠ. 아무튼 STOP버튼을 누르고 프로그램을 종료하시기 바랍니다. 그리고 한번 COM 포트를 선정했으면 다시 프로그램을 실행해서 재선택을 해야합니다. 소소한 버그인데 다음 버젼이 언제 만들어질진 몰라도 그때 반영해야할 듯 합니다.
이제 필요한 핵심적인 코드만 살짝 설명하도록 하겠습니다.
|
1 2 3 4 5 6 7 8 9 10 11 12 13 14 15 16 |
void calAngles(String s) { int lastPosInString = s.indexOf('>'); s = s.substring(1, lastPosInString); int arsResultArray[] = int(split(s, ',')); rollAng = subset(rollAng, 1); pitchAng = subset(pitchAng, 1); rollAngVel = subset(rollAngVel, 1); pitchAngVel = subset(pitchAngVel, 1); rollAng = append(rollAng, float(arsResultArray[0])*0.001*180/PI); pitchAng = append(pitchAng, float(arsResultArray[1])*0.001*180/PI); rollAngVel = append(rollAngVel, float(arsResultArray[2])*0.001*180/PI); pitchAngVel = append(pitchAngVel, float(arsResultArray[3])*0.001*180/PI); } |
위 함수는 가장 중요한 ARS로부터 각도 데이터를 받아서 실제 각도로 사용하는 루틴입니다. 그래프를 그리기 위해 500개의 데이터를 저장해서 그걸 반복적으로 그리도록 해서 12행부터 15행까지를 만들었습니다. 그 형태는 사용하시고자 하는 형태로 적절히 바꾸시면 됩니다.
일단, NT-ARSv1은 한 세트의 데이터가 <, >로 묶여있습니다. 그래서 indexOf()함수를 2행에서 이용해서 >의 위치를 확인합니다. 그리고, 첫 글자는 <이기 때문에 <와 >안에 있는 데이터만 가지고 오겠다는것이 3번행의 의미입니다.
그러면 NT-ARS가 보낸 데이터중 <와 >를 빼고 roll각도, pitch각도, roll각속도, pitch각속도 만 남게 됩니다. 이를 콤마(,)를 기준으로 분리(split)해서 배열로 저장하는 것이 5번행입니다. 그래서 5번행까지 실행되면 배열에 roll각도, pitch각도, roll각속도, pitch각속도가 순서대로 저장됩니다. 아직 문제가 남아 있는데요. 이렇게 저장된 값은 아직도 문자열입니다. 그래서 다시 int로 형변환을 한것입니다. Processing에서는 이렇게 해도 -부호까지 고려하기 때문에 부호에는 신경쓸 필요가 없습니다.
이제 12행부터 15번행까지는 같은 내용이니 12번행만 기준으로 이야기하면, ARS는 라디안단위의 각도 혹은 각속도에 1000을 곱해서 전송하기 때문에, 그래프로 표현하기 위해서 다시 0.001일 곱하고, 라디안을 디그리(degree)로 표현하기 위해 180/Pi를 곱한겁니다. 추가로 append 명령은 배열의 끝에 값을 추가하는 명령입니다. 소스코드를 보시면 아시겠지만, 하나를 추가하고 다시 제일 첫번째 값을 지우면서 전체 배열의 크기는 500을 유지하도록 되어 있습니다.
위에 보내드린 압축화일을 풀면 다 나오는 거지만, 전체 코드도 같이 공개합니다. 소스코드는 monitorNTARSv1.pde, arsClass.pde, initPanel.pde이렇게 세개의 화일로 되어 있습니다.
|
1 2 3 4 5 6 7 8 9 10 11 12 13 14 15 16 17 18 19 20 21 22 23 24 25 26 27 28 29 30 31 32 33 34 35 36 37 38 39 40 41 42 43 44 45 46 47 48 49 50 51 52 53 54 55 56 57 58 59 60 61 62 63 64 65 66 67 68 69 70 71 72 73 74 75 76 77 78 79 80 81 82 83 84 85 86 87 88 89 90 91 92 93 94 95 96 97 98 99 100 101 102 103 104 105 106 107 108 109 110 111 112 113 114 115 116 117 118 119 120 121 122 123 124 125 126 127 128 129 130 131 132 133 134 135 136 137 138 139 140 141 142 143 144 145 146 147 148 149 150 151 152 153 154 155 156 157 158 159 160 161 162 163 164 165 166 167 168 169 170 171 172 173 174 175 176 177 178 179 180 181 182 183 184 185 186 187 188 189 190 191 192 193 194 195 196 197 198 199 200 201 202 203 204 205 206 207 208 209 210 211 212 213 214 215 216 217 218 219 220 221 222 223 224 225 226 227 228 229 230 231 232 233 234 |
/* **************************************************************************** This program is monitoring program of NT-ARSv1 made by NTRexLAB. The commercial web-page of NT-ARSv1 is http://ntrexgo.com In NT-ARSv1, commands are as follows: <CAO> : to get data at once <CAH> : to get data continuously at 10ms intervals <CAE> : to stop recieving data. And incomming data is organized as follows: <Roll angle, Pitch angle, Roll angular velocity, Pitch angular velocit>. The NT-ARSv1's output data are multiplying 1000 times after expressed radians. by PinkWink in NTRexLAB **************************************************************************** */ import controlP5.*; import processing.serial.*; ControlP5 cp5; Serial arsPort; DropdownList l; ArsButtons pauseBt, stopBt, rollAngBt, pitchAngBt, rollAngVelBt, pitchAngVelBt; int graphPanelXPos = 110; int graphPanelYPos = 100; int graphPanelXSize = 500; int graphPanelYSize = 240; int graphPanelYCenterPos = graphPanelYPos+graphPanelYSize/2; int panelGridHalfLength = 15; int panelGridYDivision = graphPanelYSize/6; int selectPanelXPos = graphPanelXPos; int selectPanelYPos = graphPanelYPos+graphPanelYSize+40; int selectPanelXSize = graphPanelXSize; int selectPanelYSize = panelGridYDivision; int buttonXStartPos = graphPanelXPos+60; int buttonYPos = selectPanelYPos+selectPanelYSize/2; int buttonXDiv = selectPanelXSize/5; float resizingYSize = float(graphPanelYSize)/180; float resizingAngVelYSize = float(graphPanelYSize)/1000; float[] rollAng = new float[graphPanelXSize]; float[] pitchAng = new float[graphPanelXSize]; float[] rollAngVel = new float[graphPanelXSize]; float[] pitchAngVel = new float[graphPanelXSize]; String availablePort[]; String connectPort; String[] graphYLabel = {"90", "60", "30", " 0", "-30", "-60", "-90"}; boolean arsConnection = false; PFont fontText, bigfontText; color ColorOfBackground = color(245,245,245); color ColorOfListBoxBackground = color(190,190,190); color ColorOfListBoxActive = color(150,150,150); color ColorOfListBoxForeground = color(150,150,150); color ColorOfListBoxSetColor = color(100,100,100); color ColorOfRollAngLine = color(255,0,0); color ColorOfPitchAngLine = color(0,255,0); color ColorOfRollAngVelLine = color(255,100,0); color ColorOfPitchAngVelLine = color(100,255,0); void setup() { size(650, 450); fontText = loadFont("CenturyGothic-12.vlw"); bigfontText = loadFont("CenturyGothic-32.vlw"); pauseBt = new ArsButtons(graphPanelXPos, graphPanelYPos-30, false, "rec"); stopBt = new ArsButtons(graphPanelXPos+80, graphPanelYPos-30, false, "rec"); rollAngBt = new ArsButtons(buttonXStartPos, buttonYPos, true, "ell"); pitchAngBt = new ArsButtons(buttonXStartPos+buttonXDiv, buttonYPos, true, "ell"); rollAngVelBt = new ArsButtons(buttonXStartPos+buttonXDiv*2, buttonYPos, false, "ell"); pitchAngVelBt = new ArsButtons(buttonXStartPos+buttonXDiv*3, buttonYPos, false, "ell"); cp5 = new ControlP5(this); l = cp5.addDropdownList("AvailablePorts"); comPortList(l); } void draw() { background(ColorOfBackground); drawGraphPanel(); drawText(); drawGraph(); } void mousePressed(){ if(mouseButton==LEFT){ if(rollAngBt.isButtonClicked(mouseX, mouseY, 10)) { rollAngBt.buttonClick(); } if(pitchAngBt.isButtonClicked(mouseX, mouseY, 10)) { pitchAngBt.buttonClick(); } if(rollAngVelBt.isButtonClicked(mouseX, mouseY, 10)) { rollAngVelBt.buttonClick(); } if(pitchAngVelBt.isButtonClicked(mouseX, mouseY, 10)) { pitchAngVelBt.buttonClick(); } if(pauseBt.isButtonClicked(mouseX, mouseY, 10)) { pauseBt.buttonClick(); } if(stopBt.isButtonClicked(mouseX, mouseY, 10)) { if(stopBt.buttonClicked) { stopBt.buttonClick(); arsPort.write("<CAH>"); delay(20); }else { stopBt.buttonClick(); arsPort.write("<CAE>"); delay(20); } } } } void drawGraph() { noFill(); if (rollAngBt.buttonClicked) { stroke(ColorOfRollAngLine); strokeWeight(2); beginShape(); for (int xPos=0; xPos<rollAng.length; xPos++) { float tmp = saturatingValue(rollAng[xPos], 90); vertex(xPos+graphPanelXPos, graphPanelYCenterPos - tmp*resizingYSize); } endShape(); } if (pitchAngBt.buttonClicked) { stroke(ColorOfPitchAngLine); strokeWeight(2); beginShape(); for (int xPos=0; xPos<pitchAng.length; xPos++) { float tmp = saturatingValue(pitchAng[xPos], 90); vertex(xPos+graphPanelXPos, graphPanelYCenterPos - tmp*resizingYSize); } endShape(); } if (rollAngVelBt.buttonClicked) { stroke(ColorOfRollAngVelLine); strokeWeight(1); beginShape(); for (int xPos=0; xPos<rollAngVel.length; xPos++) { float tmp = saturatingValue(rollAngVel[xPos], 500); vertex(xPos+graphPanelXPos, graphPanelYCenterPos - tmp*resizingAngVelYSize); } endShape(); } if (pitchAngVelBt.buttonClicked) { stroke(ColorOfPitchAngVelLine); strokeWeight(1); beginShape(); for (int xPos=0; xPos<pitchAngVel.length; xPos++) { float tmp = saturatingValue(pitchAngVel[xPos], 500); vertex(xPos+graphPanelXPos, graphPanelYCenterPos - tmp*resizingAngVelYSize); } endShape(); } } void serialEvent(Serial p) { String arsValues = ""; arsValues = arsPort.readStringUntil(10); if (!pauseBt.buttonClicked && (arsValues != null)) { calAngles(arsValues); } } float saturatingValue(float target, float limitValue) { float resizingResult; float tmp = abs(target); if (tmp>limitValue) { resizingResult = target/tmp*limitValue; } else { resizingResult = target; } return resizingResult; } void calAngles(String s) { int lastPosInString = s.indexOf('>'); s = s.substring(1, lastPosInString); int arsResultArray[] = int(split(s, ',')); rollAng = subset(rollAng, 1); pitchAng = subset(pitchAng, 1); rollAngVel = subset(rollAngVel, 1); pitchAngVel = subset(pitchAngVel, 1); rollAng = append(rollAng, float(arsResultArray[0])*0.001*180/PI); pitchAng = append(pitchAng, float(arsResultArray[1])*0.001*180/PI); rollAngVel = append(rollAngVel, float(arsResultArray[2])*0.001*180/PI); pitchAngVel = append(pitchAngVel, float(arsResultArray[3])*0.001*180/PI); } void controlEvent(ControlEvent theEvent) { if (theEvent.isGroup() && theEvent.name().equals("AvailablePorts")){ int connectPortNo = (int)theEvent.group().getValue(); connectPort = availablePort[connectPortNo]; } if (!arsConnection) { arsPort = new Serial(this, connectPort, 115200); arsConnection = true; } delay(100); arsPort.write("<CAH>"); } void comPortList(DropdownList ddl) { availablePort = arsPort.list(); ddl.setPosition(10, 70); ddl.setSize(80, 60); ddl.setItemHeight(15); ddl.setBarHeight(15); ddl.setColorBackground(ColorOfListBoxBackground); ddl.setColorActive(ColorOfListBoxActive); ddl.setColorForeground(ColorOfListBoxForeground); ddl.setValue(0); ddl.captionLabel().toUpperCase(true); ddl.captionLabel().set("AvailablePorts"); ddl.captionLabel().setColor(ColorOfListBoxSetColor); ddl.captionLabel().style().marginTop = 3; ddl.valueLabel().style().marginTop = 3; for (int i=0; i<availablePort.length; i++) { l.addItem(availablePort[i], i); } } |
|
1 2 3 4 5 6 7 8 9 10 11 12 13 14 15 16 17 18 19 20 21 22 23 24 25 26 27 28 29 30 31 32 33 34 35 36 37 38 39 40 41 42 43 44 45 46 47 48 49 50 51 52 |
class ArsButtons { int posX, posY; String type; boolean buttonClicked; color ColorOfClickedButton = color(150,150,150); ArsButtons(int tmpX, int tmpY, boolean initValue, String tmpType) { buttonClicked = initValue; posX = tmpX; posY = tmpY; type = tmpType; drawButton(); } boolean isButtonClicked(int X, int Y, int buttonArea) { boolean buttonClickedResult = false; if (type=="rec") { if(X<(posX+buttonArea) && X>posX && Y<(posY+buttonArea) && Y>posY) { buttonClickedResult = true; } } else if (type=="ell") { if(X<(posX+buttonArea/2) && X>(posX-buttonArea/2) && Y<(posY+buttonArea/2) && Y>(posY-buttonArea/2)) { buttonClickedResult = true; } } return buttonClickedResult; } void buttonClick() { if (buttonClicked) { buttonClicked = false; } else { buttonClicked = true; } } void drawButton() { fill(ColorOfBackground); if (type=="rec") { rect(posX, posY, 10, 10); if (buttonClicked) { fill(ColorOfClickedButton); } else { fill(ColorOfBackground); } rect(posX+2, posY+2, 6, 6); } else if (type=="ell") { ellipse(posX, posY, 10, 10); if (buttonClicked) { fill(ColorOfClickedButton); } else { fill(ColorOfBackground); } ellipse(posX, posY, 6, 6); } } } |
|
1 2 3 4 5 6 7 8 9 10 11 12 13 14 15 16 17 18 19 20 21 22 23 24 25 26 27 28 29 30 31 32 33 34 35 36 37 38 39 40 41 42 43 44 45 46 47 48 49 50 51 52 53 |
void drawGraphPanel(){ stroke(ColorOfListBoxForeground); strokeWeight(1.5); fill(color(255,255,255)); rect(graphPanelXPos, graphPanelYPos, graphPanelXSize, graphPanelYSize); fill(ColorOfBackground); rect(selectPanelXPos, selectPanelYPos, selectPanelXSize, selectPanelYSize); pauseBt.drawButton(); stopBt.drawButton(); rollAngBt.drawButton(); pitchAngBt.drawButton(); rollAngVelBt.drawButton(); pitchAngVelBt.drawButton(); strokeWeight(1); for (int i=(graphPanelYPos+panelGridYDivision); i<(graphPanelYPos+graphPanelYSize); i=i+panelGridYDivision) { for (int j=(graphPanelXPos+buttonXDiv); j<(graphPanelXPos+graphPanelXSize); j=j+buttonXDiv) { line(j+panelGridHalfLength, i, j-panelGridHalfLength, i); line(j,i+panelGridHalfLength, j, i-panelGridHalfLength); } } int tmpX = graphPanelXPos+graphPanelXSize/10; for (int i=0; i<9; i++) { line(tmpX-panelGridHalfLength+i*graphPanelXSize/10, graphPanelYCenterPos, tmpX+panelGridHalfLength+i*graphPanelXSize/10, graphPanelYCenterPos); } } void drawText() { textFont(bigfontText); fill(100); text("NT-ARSv1 Monitor",10,35); textFont(fontText); text("This Processing code is monitoring program for NT-ARSv1",280,51); text("NT-ARSv1 Monitoring Ver. 0.80 by PinkWink in NTRexLAB.",280,63); //text("by PinkWink in http://pinkwink.kr/",420,75); text("x division = 1 second", graphPanelXPos+graphPanelXSize/2-50,graphPanelYPos+graphPanelYSize+15); for (int i=0; i<7; i++){ text(graphYLabel[i], graphPanelXPos-20, graphPanelYPos+panelGridYDivision*i+5); } text("RollAngle", buttonXStartPos+11, buttonYPos+5); text("PitchAngle", buttonXStartPos+buttonXDiv+11, buttonYPos+5); text("RollAngVel", buttonXStartPos+buttonXDiv*2+11, buttonYPos+5); text("PitchAngVel", buttonXStartPos+buttonXDiv*3+11, buttonYPos+5); text("Pause", graphPanelXPos+13, graphPanelYPos-20); text("STOP", graphPanelXPos+93, graphPanelYPos-20); } |
사용하고 있는 라이브러리 중 serial 라이브러리는 기본으로 같이 설치되는데요. 또 하나 사용하고 있는게 controlP5입니다. 이는 Processing 공식 홈페이지에서 추가 다운로드가 가능합니다. DropdownList를 꼭 쓰고 싶었는데 직접 만들기가 귀찮아서 가져다 사용했습니다. 그리고, arsClass는 GUI를 Processing에서 기본 지원을 하지 않기 때문에 배포되는 라이브러리를 사용하거나 직접 만들거나 해야하는데요. 이번에는 사용되는 총 6개의 버튼을 직접 만들었습니다. 그 공통 속성과 함수를 모아논 클래스입니다. initPanel은 기본적인 화면 구성을 별도로 배치 시켜 둔것입니다.
그러면 이제 저희 NT-ARSv1을 Processing에서 코딩하시고자 하는 분들께 작은 도움이라도 되었으면 합니다.^^
